The safest way to restructure a complex Google Sheets financial model without breaking formulas is to add new structure alongside the existing one, validate outputs match, then remove the old columns — never move cells with live cross-sheet references in place.
What the Client Had
A client came to us with a Google Sheets financial model they'd built themselves — a commercial real estate deal calculator for lease-to-own transactions on a property valued at roughly $2.3M. The brief was simple: clean it up and make the formulas consistent. About 200 cells, half with formulas.
Small job on paper. When I opened the file, I understood immediately why they hadn't fixed it themselves.
What Was Actually There
The model handled a dual-loan financing structure (a bank loan at 8% and an anchor loan at 6%), lease revenue at $1.45/sqft/month across 48,000+ square feet, anchor tenant revenue sharing, and six lease-to-own scenarios ranging from 12 to 72 months.
The calculations were correct. The problem was the layout.
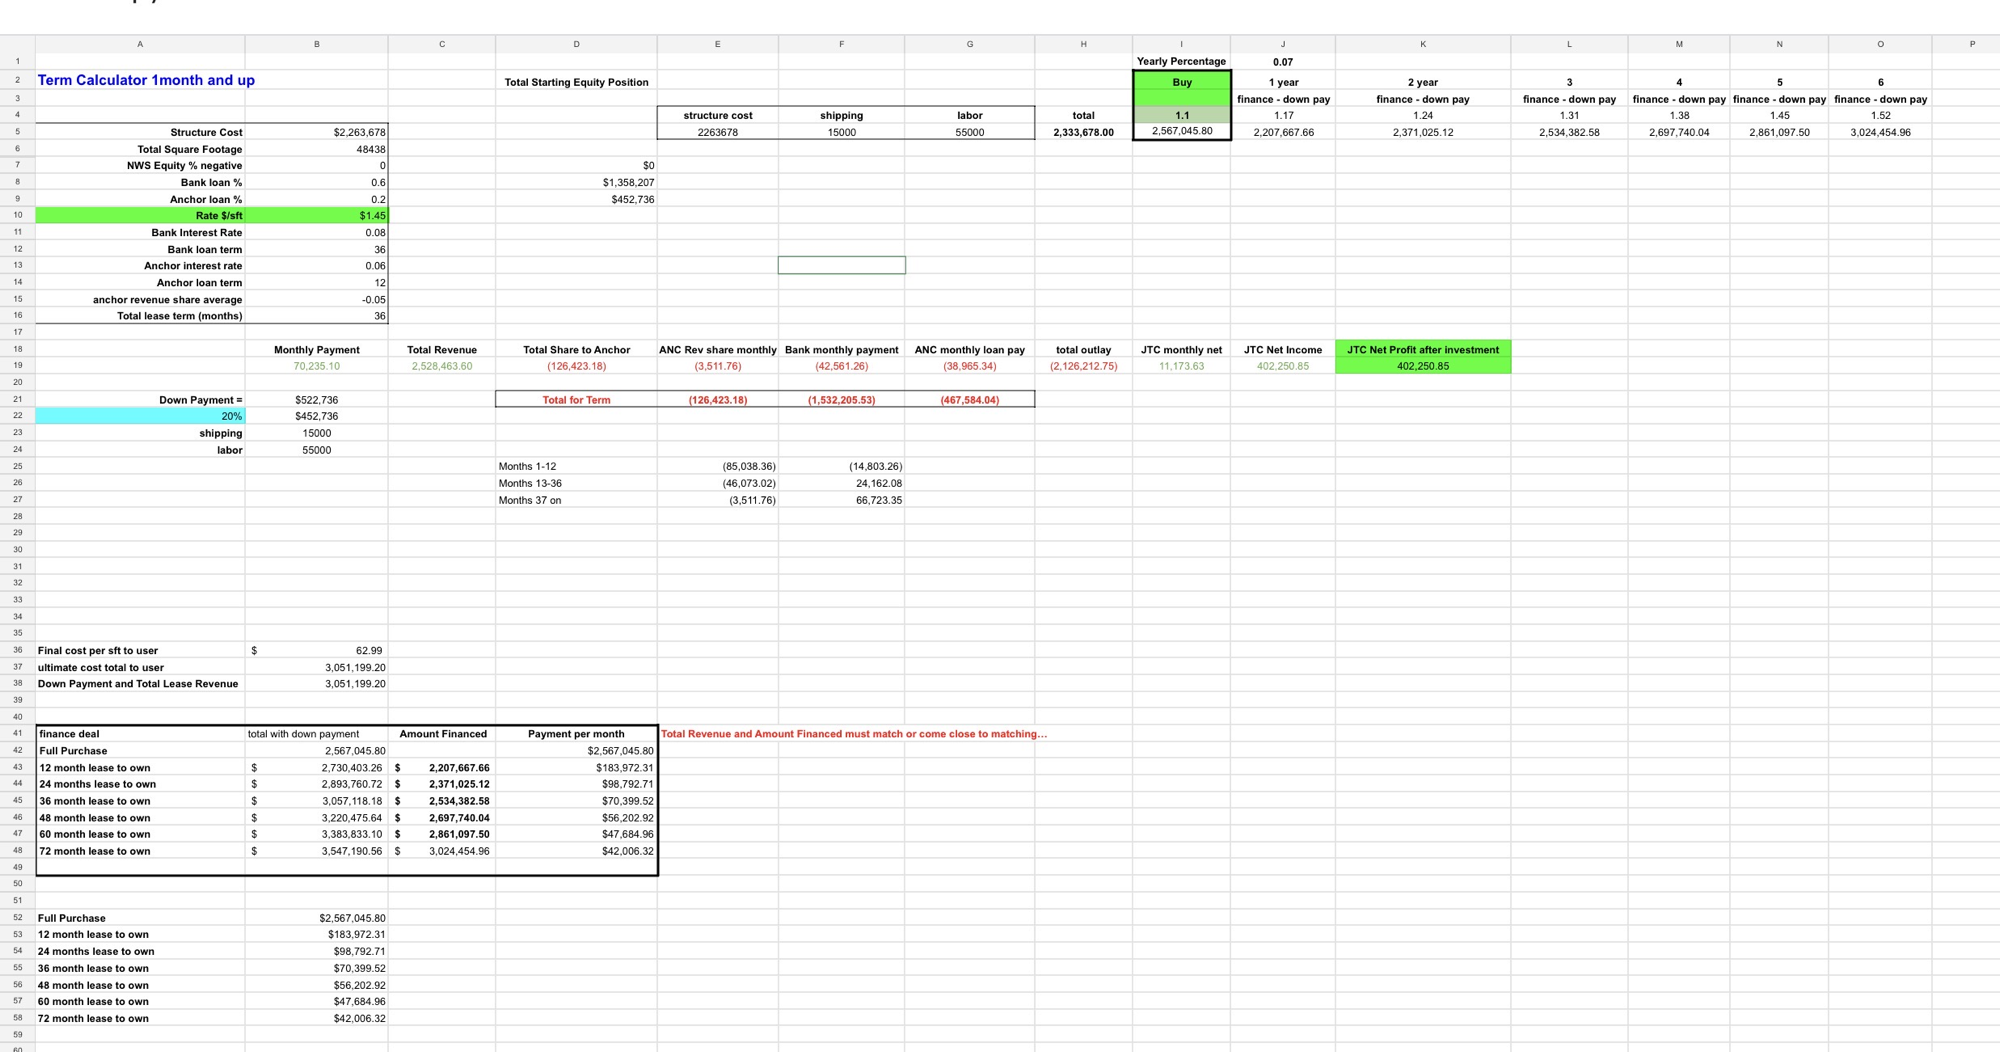
Before: inputs, calculations, and outputs mixed together with no consistent direction across 16 columns.
Formulas were scattered across 16 columns — A through P — with no consistent direction. A value in column B might pull from column J. A result in column E fed a formula in column B two rows up. Inputs, intermediate calculations, and outputs were mixed together with no visual separation. There were two versions of the finance deal table sitting in the same sheet, one below the other, with no obvious relationship between them.
If you changed the bank interest rate, you couldn't tell by reading the sheet where that change would flow. You'd have to trace it.
Rebuild or Restructure — and Why This Choice Matters
The instinct when you see a messy spreadsheet is to start fresh. Blank sheet, clean formulas, build it the right way from scratch. For a lot of jobs that's correct.
Not here. This was a financial model that someone had been using to evaluate real deals. The formulas were tested against actual numbers — they'd seen real input values, caught edge cases, and produced outputs someone had verified. Rebuilding from scratch would have required revalidating every formula from the ground up. For a model with bank interest amortisation, anchor tenant revenue sharing that steps down across three time periods, and six parallel lease scenario projections — that's a meaningful risk of introducing new errors while trying to fix the layout.
The safer path was restructuring in place: preserve the logic exactly, change only the layout.
The Approach: Map Before You Move Anything
With ~100 formulas referencing each other across a 2D grid, moving a cell without checking what references it breaks something else. The first step wasn't cleanup — it was auditing the dependency graph.
I went through every formula cell and documented what it referenced and what referenced it. This is tedious but not optional. In a scattered layout, a cell that looks like a result (because it has a dollar value and sits at the bottom of a section) might actually be referenced as an input by three other formulas above it. Move it without knowing that and those formulas all break silently — they start pulling from an empty cell and returning zero, with no error to warn you.
The duplicate finance table was one of those cases. One version had live formulas pulling from the calculator inputs. The other had hardcoded values — a snapshot, probably from a specific scenario the client had been showing someone. They looked identical. Deleting one without checking which was which would have killed the live version.
What We Built
The restructured model has a single vertical flow: inputs at the top, calculations in the middle, outputs at the bottom. Dark header rows divide it into named sections — Property Inputs, Financing Inputs, Lease & Revenue, Cost Breakdown, Loan Calculations, Monthly Figures, Cash Flow by Period, Full Term Totals, Appreciation Over Time.
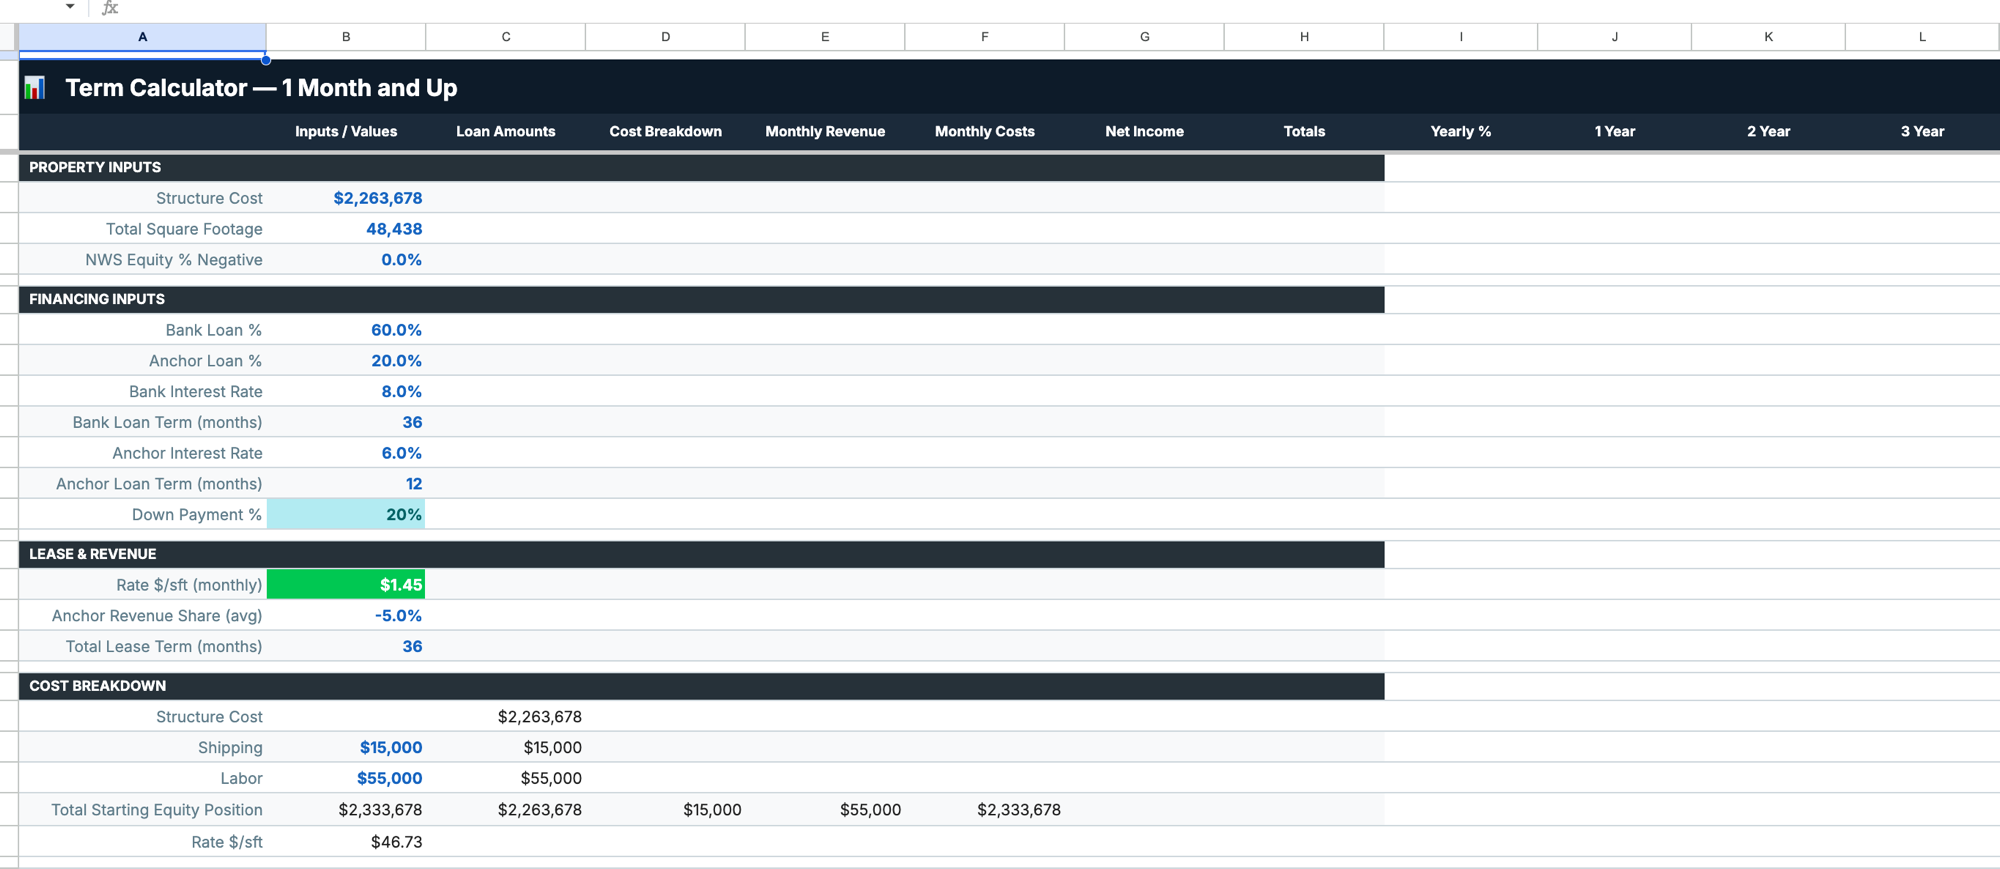
After: named sections with dark header rows, inputs in column B, results reading right across clearly labelled columns.
Every input is in column B. Every calculated result is in a clearly labelled row to the right, in a column that corresponds to what it represents (Loan Amounts, Cost Breakdown, Monthly Revenue, Monthly Costs, Net Income, Totals). If you want to know what drives a number, you read left: the input is on the same row or in the section above it.
The lease-to-own scenarios (12 through 72 months) moved to a separate sheet — Finance Deals. Clean table: Finance Deal, Total with Down Payment, Amount Financed, Payment per Month. The note at the bottom tells the user when to go back and update the main calculator inputs for the numbers to reconcile.
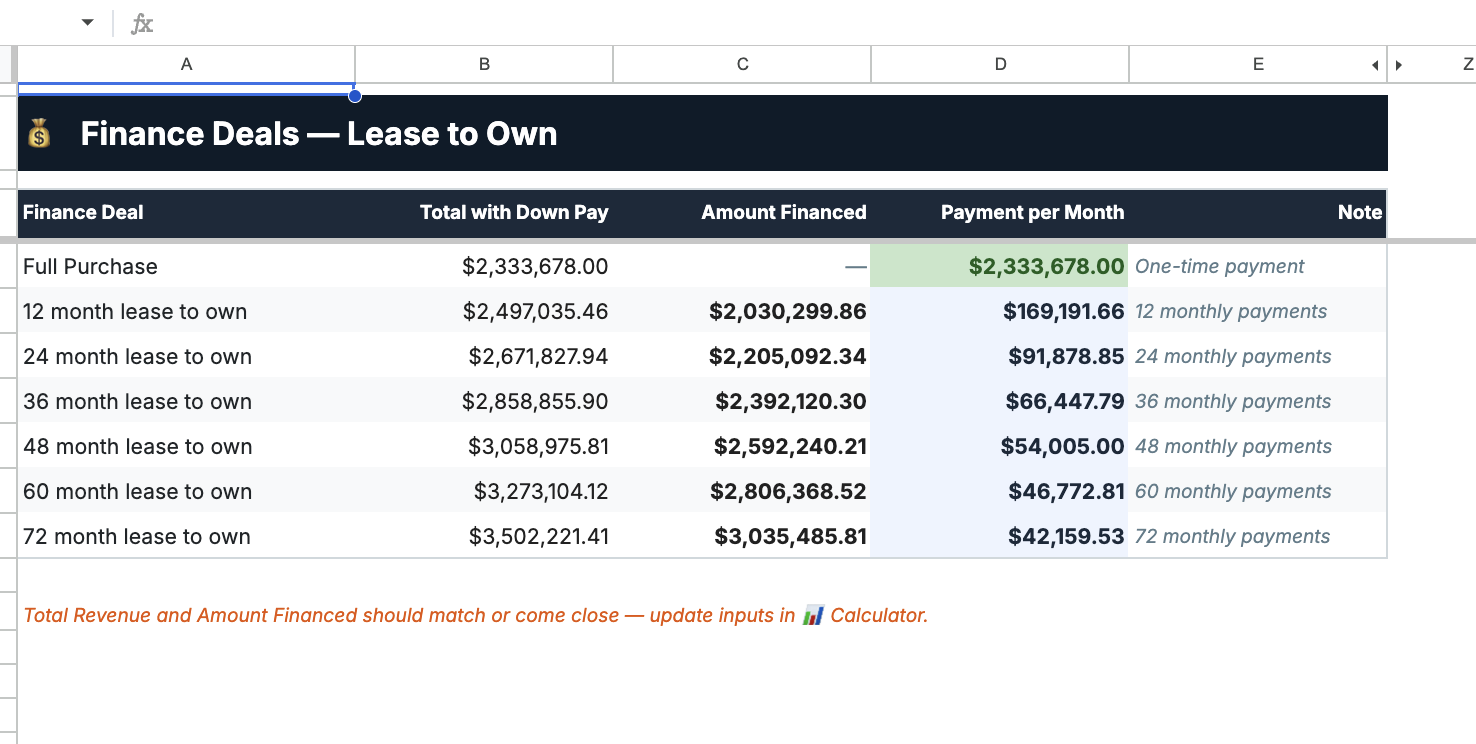
The lease-to-own scenarios moved to a dedicated sheet — six rows, four columns, one note telling the user when to reconcile against the main calculator.
The cash flow breakdown that was previously scattered across random cells is now its own section: three rows for the three time periods (Months 1–12, 13–36, 37+), three columns for ANC Revenue Share, Bank Payment, Net Position. You can read the deal's cashflow trajectory in six cells.
The Numbers
The Gotcha: When Results Are Also Inputs
The hardest part of any restructure-in-place job isn't moving the cells — it's finding the cells you can't move.
In the original layout, the "Total Starting Equity Position" figure sat in a cluster of output cells in the middle of the sheet. It looked like a result. It was also the basis for the anchor loan percentage calculation four rows above it in a different column. Moving it without updating that reference — or moving it after already having moved the anchor loan row — would have produced a silent error. The anchor loan dollar amount would have recalculated to zero, which flows into the monthly payment calculation, which flows into total outlay, which flows into net income. Everything downstream would have been wrong, with no red cell to flag it.
The rule we follow: never move a cell until you've confirmed nothing upstream references it. Trace first, move second. In a 200-cell sheet this is manageable. In a 2,000-cell sheet it's why you use named ranges from the start.
What the Cleaned Model Enables
The client can now update a single input — say, the bank interest rate ticks up from 8% to 8.5% — and read the full impact on monthly payments, total outlay, and net profit in the rows immediately below it. They don't need to trace formulas to find where the change lands.
More importantly, someone who wasn't involved in building the model can now open it and understand it. For a deal involving $2.3M in property and 36–72 month financing commitments, that matters. You're not going to put this in front of a bank or a business partner when the layout requires a tutorial to navigate.
A working spreadsheet and a readable spreadsheet are not the same thing. The original was working. The restructured version is both.
Have a spreadsheet that works but nobody can read? Whether it's a financial model, a pricing calculator, or an operational tracker — if the person who built it is the only one who can use it, it's a risk. We can audit it, restructure it, and document what it actually does.
Talk to us